From the ground, it just looks cloudy.  But as you go up in an airplane, you see the makeup of the atmosphere is much more complex — with several layers of clouds making up the overcast we see from our backyard.
If you know how to read the Skew-T weather map, you can figure out exactly how high those clouds are, layer by layer!
Twice each day, at exactly the same time, weather balloons are launched and hundreds of locations across North America and around the world.
The helium-filled balloons rise quickly through the atmosphere toting a box of weather instruments called a radiosonde.
The radiosonde transmits bursts of weather data back to the ground all the while being tracked by scientists at the launch sites.
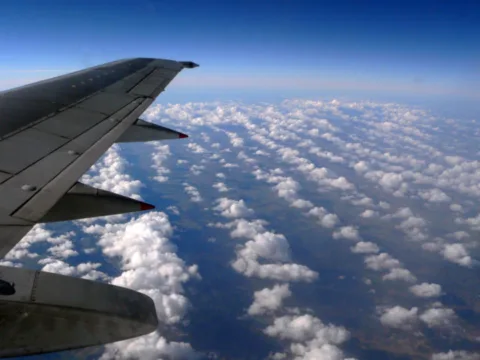
This photo was taken on February 29th aboard a flight from Indianapolis to Houston:

We were descending from 36,000 feet and had just gone through the high layer of clouds.
As you can see, there is still another solid cloud deck below us.
I would estimate we were about 20,000 feet above the ground at this point. We were somewhere over Louisiana.
OK, so here is what’s called a sounding. That’s the information from the radiosonde plotted on a Skew-T chart:
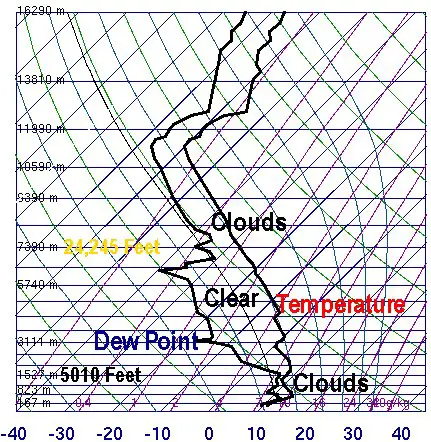
This sounding is from Shreveport, Louisiana the morning of February 29th — the same day as the photograph above.
The Skew-T chart is something that takes a semester of college to fully understand. For today, we’ll just focus on where those clouds are located.
- The right line crooked line in the photograph represents the temperature measured by the radiosonde as it ascended into the atmosphere.
- The left crooked line is the dew point.
- Meteorology 101 tells us when the temperature and dew point are equal, the relative humidity is 100% and clouds will form.
- The farther apart the temp and dew point, the lower the relative humidity.
On the Skew-T chart, notice the temperature and dew point are very close together in the lower 5000 feet of the atmosphere. That’s where the clouds are on the bottom of the photograph above.
Then, notice the area on the Skew-T chart where the temperature and dew point lines spread apart — from about 5000 feet up to just above 24,000 feet. That layer of the atmosphere has lower relative humidity, hence no clouds. That is where we were flying when I took the photo.
Next, on the Skew-T chart the lines come back together at roughly 24,245 feet indicating very high relative humidity and another layer of clouds. Those are the clouds are the top of the photograph taken from the plane.
There are lots of websites where you can look at the latest Skew-T chart from your area. The one used here is from The University of Wyoming’s Department of Atmospheric Science.
We show and discuss the Skew-T chart regularly on our TV Video Blog called the Weather EXTRA on my TV station’s website weather page. We call it The Domingo Chart on the blog because our director’s name is Domingo, and seeing the Skew-T everyday has turned him into a weather nut. Check it out sometime!

